3. Cluster Utilization
The Cluster Utilization dashboard complements the Cluster Contention dashboard. Together, their goal is to help VMware Administrator in performance management.
Design Consideration
This dashboard is designed to support the Cluster Contention dashboard. Use it to identify vSphere clusters with high utilization in a selected data center. When utilization exceeds 100%, performance can be negatively impacted especially when VMs experience contention. By default, vRealize Operations has a 5-minute collection interval. For 5 minutes, there may be 300 seconds worth of data points. If a spike is experienced for a few seconds, it may not be visible if the remaining of the 300 seconds is low utilization.
See the Performance Dashboard page for common design consideration among all the dashboards for performance management.
How to Use
Review the 2 distribution charts
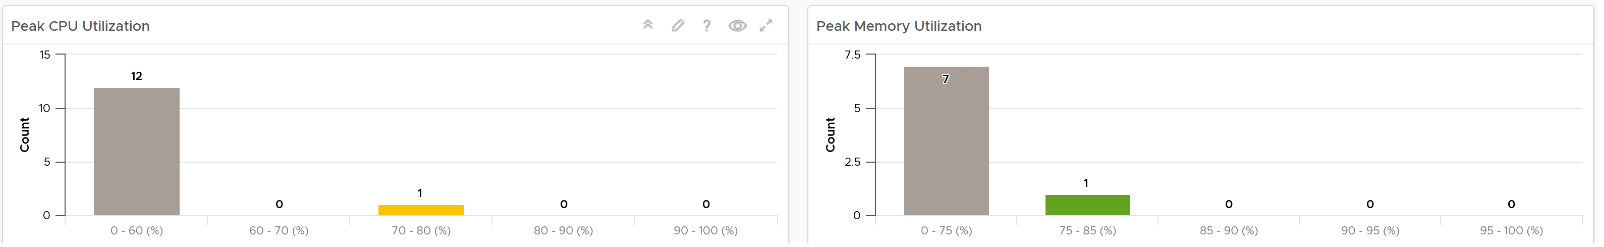
- They give an overview of all the clusters CPU utilization and memory utilization.
- The highest metric in the last 1 week is used. Average or 95thpercentile is not used as this is utilization, not contention. High utilization does not mean bad performance.
- 1 week is used instead of 1 day to give you a longer time horizon and cover the weekend. Adjust the timeline as you deem fit for your operations.
- Expect memory to be higher than CPU, as it’s a form of cache. The Memory Consumed counter is used, as it’s more appropriate than the Memory Active counter.
- Low utilization can actually indicate bad performance, as not much of real work got done. The chart uses the color dark grey for low utilization.
Review the Clusters Utilization table
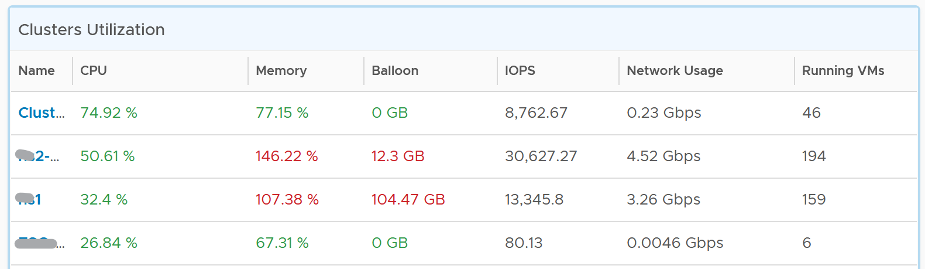
- It lists all the clusters, sorted by the highest utilization in the last 1 week. If the table is all showing green, then there is no need to analyze further.
- You can change the time period to the period of your interest. The maximum number will be reflected accordingly.
Select a cluster from the table
- All the utilization charts will automatically show the key utilization metrics of the selected cluster.
- For memory, the high utilization counters are explicitly shown. Balloon, Compressed, Swapped. Notice they exist even though utilization is not even 90%, indicating high pressure in the past. If you look at only utilization, you’d think you are safe!
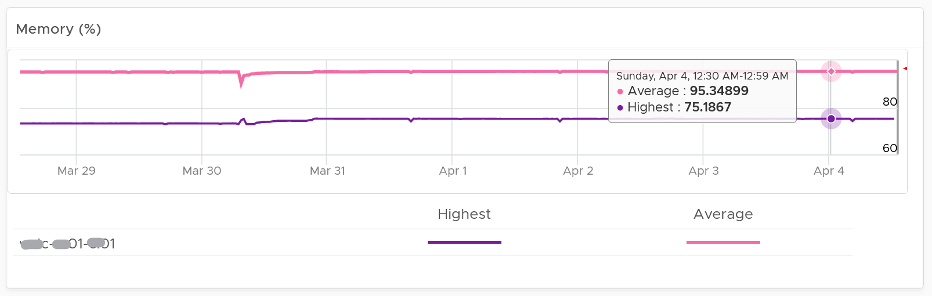
- The line charts shows both average and highest among ESXi host in the cluster. The reason is unbalanced is not rare. There are many settings that can contribute to it (e.g. DRS settings, VM Reservation, VM - Host Affinity, Resource Pool, Stretched Cluster, Large VM). So check all these as unbalanced cluster is quite common, especially in large clusters.
- The disk IOPS is split into read & write to gain insight into the behaviour. Some workloads are read-oriented, while others are write-oriented.
- The disk throughput is not shown as it sums all the traffic. In reality, each ESXi has its own limit.
- The vMotion line chart is added as a high number of vMotion can indicate the cluster load is volatile, assuming the DRS Automation level is not set to the most sensitive setting.
Points to Note
- If your operations team has a standard that utilization should not exceed a certain threshold, you can add that threshold value into the line chart. The threshold line will help less technical teams as they can see how the real value compares with the threshold.
- See the Points to Note section of Cluster Contention dashboard as this dashboard is designed to complement it.
- Consider adding a 3rd distribution chart. Show the balloon counter in this 3rd chart, as it complements the consumed counter. As long as there is no ballooning, a very high consumed value is in fact better than a lower value.
- The Workload metric can exceed 100% because it’s demand / usable capacity * 100. So this could happen if you have 4 hosts in a cluster with each host running at 100% demand and admission control is set to 50%.
This page was last updated on June 30, 2021 by Stellios Williams with commit message: "Cleaned MD syntax"
VMware and the VMware taglines, logos and product names are trademarks or registered trademarks of VMware in the U.S. and other countries.