4. Performance Management
Performance ranks high in VDI operations so let’s start with it. Horizon is a complex architecture with many components and layer. How do you know Horizon is performing?
One good way to answer is to begin with the end in mind. The purpose of DaaS is to provide acceptable user experience. To deliver that, there are 3 components (Edge, Network, Data Center) that must work well. Horizon is a client/server architecture, meaning it has a Horizon Client software that runs at the edge, talking via the network to a server agent software residing in the data center.
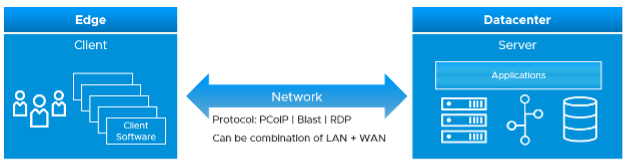
The client software does the screen rendering. Due to lack of contention and utilization metrics, we can’t measure its performance. Some thin client or zero client has a tiny OS that support syslog.
The network consists of the protocol and the physical network. Typically, the physical network carries more than Horizon protocol. For example, you have IP telephony system, security cameras or remote servers in your branches. You need to have visibility at the consumer (Horizon protocol) level and provider (physical network) level. In most cases, the network is not owned by the EUC team, so EUC team is consuming a shared service. Because of this, the physical network metrics play the supporting role. They are not primary metrics used in the KPI.
The data center part is where the bulk of EUC component resides. This includes both VMware and non-VMware components.
The network part and the data center part are two independent parts, typically managed by different teams. You can have network problem without the data center problem, and vice versa. By separating them as separate KPI, you can see what kind of problems you have and do the necessary follow up. By combining them, you can potentially lose visibility as the good one can mask the bad one.
Be mindful of the difference between the user has performance problem and the user causes performance problem.
| Duality of users | |
|---|---|
| Victim | The user experiences problem. Contention is high, utilization is low. Not getting work done, so productivity is impacted. User is upset. |
| Villain | The user causes performance problem. Utilization is very high. Contention is irrelevant in this case. The user may get a lot of work done. Other users could be affected, so you are upset. |
Network KPI
This is easier to measure as it has fewer metrics and only has 1 type of resource.
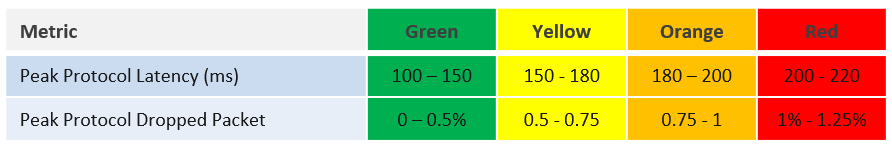
The latency is measured at PCoIP or Blast protocol layer, not TCP/UDP layer. Upper layer is more accurate as we can have packet loss at application-layer but Windows sees no dropped packet. The reason was the packet arrives out of order and hence unusable from Horizon viewpoint.
We’ve set the threshold value to be conservative yet realistic. If your users are accessing over the WAN or unreliable connection, then you may not see green. This is acceptable so long user actual productivity is not impacted.
Time taken to load the user profile and time taken to logon are not included in the KPI because they are one time value. KPI needs to be a metric that can be evaluated regularly.
At this moment, we do not include variance in the latency. If you think we should, do recommend the value for each threshold.
The session network utilization is not part of the KPI as we can’t put the value into the range. The Blast Extreme protocol may be doing minimal work at that time for that user, so a low network throughput may not indicate poor user experience.
Data Center KPI
The DC KPI depends on the types of object. A user can have VDI Session or RDS Session, served by VDI Pool and RDS Farm respectively.
| KPI | Consideration |
|---|---|
| VDI Session | It has contention metrics. As it’s Windows OS running on a vSphere VM, it has metrics from both layers. |
| RDS Session | It does not have contention metrics. It only has utilization metrics and they cannot be used to determine if a user experience degrades. This applies to both application session and desktop session. As a result, the KPI is taken from the RDS Host, which is a server VM serving many users concurrently. The drawback is RDS Host does not provide visibility into the performance of each session. |
Since both RDS Host and VDI Session is basically a Window VM, we are using the same KPI. Other than RDSH specific counter such as this one, there is no application level specific counters to measure contention. vRealize Operations uses the following counters and threshold to form the KPI.
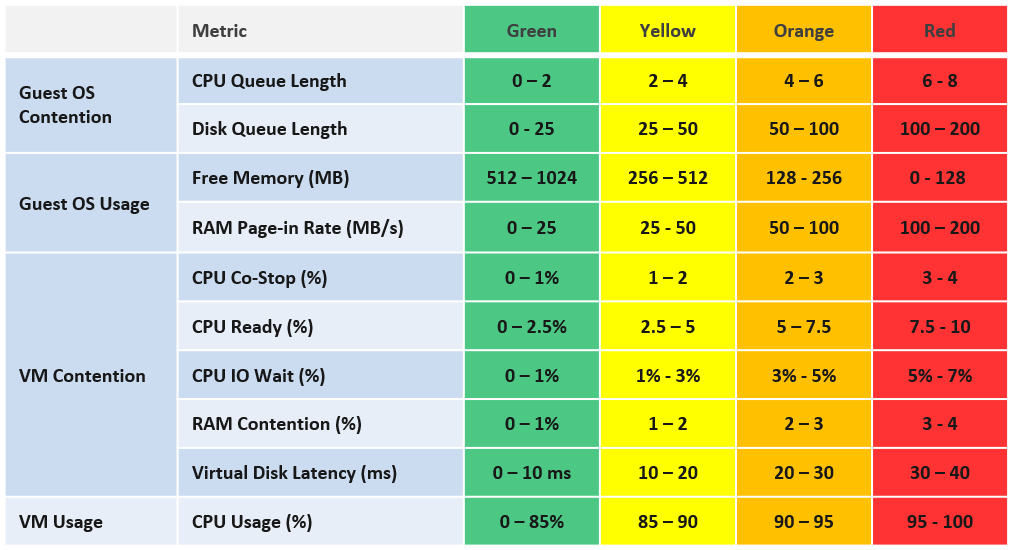
The counters above are layered into 4, matching the layer used in performance troubleshooting. Look at the contention metrics first, then the utilization type.
We provide the threshold as they reflect Horizon best practice, which should work for most customers. Your situation may differ, which is why we provide the raw metrics too as the KPI metric cannot be modified.
The CPU Queue Length is the total queue length. In future, we may convert it into per vCPU. Same with disk latency, as read and write can move independantly.
We do not include CPU Context Switch and Disk Outstanding IO, as I’m not yet convinced on the threshold, based on the profiling data. The numbers vary too wide. Send me your profiling result so I can consider it too.
We do not include CPU Overlap as the value is negligible most of the time. It will be green most of the time, hence inflating the value unnecessarily.
Do you know why we include Page-in but not Page-out? How about balloon, swapped and compressed? How come none of them are here? Refer to Part 2 Memory chapter for the answer.
We do not include Memory In Use as we have Free Memory. In Use is better for capacity, while Free is better for performance.
VM CPU utilization is included because it’s possible that we have a runaway process that it’s impacting user performance. A runaway process typically consumes 1 vCPU so if the VM has 4 CPU the increase is only 25%.
Now that we have the DC KPI and Network KPI at the smallest object, we can roll up to higher level object. For that, we need a correct hierarchy. The hierarchy is also required by other pillar of operations management.
KPI Roll Up
Using the above as the foundation, we can build the KPI at higher level object. Here is how we do it.
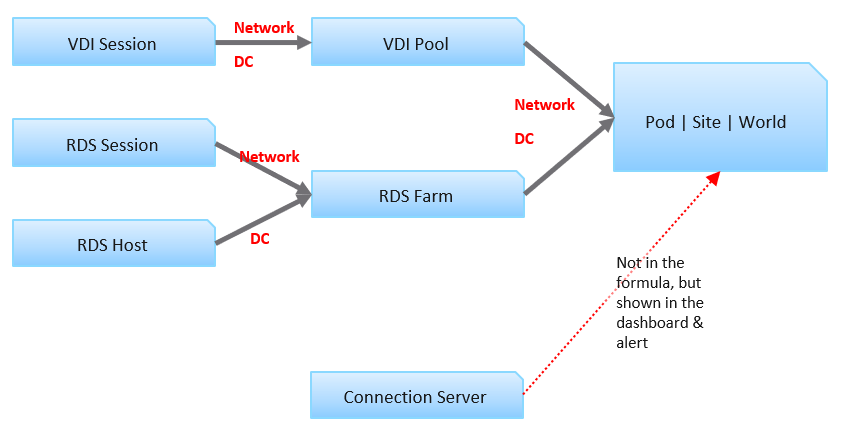
Each VDI session has 2 KPI: Network KPI and Data Center KPI.
The VDI Pool Network KPI is simply the average of all its VDI Session Network KPI. While average is a lagging indicator, it best represents the entire reality, which is required for further roll up to the higher level object. We certainly will complement it with leading indicators.
The VDI Pool DC KPI is also the average of its session DC KPI. Because these 2 KPIs operate independantly, we do not combine them.
For RDS, the correponding object is RDS Farm, not RDS Host. It’s more logical to monitor at this level, just like we monitor at vSphere cluster level and not the individual ESXi. Just like a VM moves within a cluster, a user does not always get the same RDS host in the next session. We take the network KPI from RDS sessions and DC KPI from RDS hosts.
We combine both the VDI and RDS KPI at the Pod level. Again, we simply take the average of both. If you have more VDI Pools than RDS Farms, then the Pod KPI value will be driven by the VDI part of your architecture.
Pod DC KPI = Average (VDI Pool DC KPI, RDS Farm DC KPI)
The limitation of the above is it each pools and farms are given the same weightage. The number of sessions do not matter. The reason is you manage at pool and farm level, not individual session.
The KPI for higher level objects cannot be the average of Pod KPI, as Pod is basically a group. The KPI is still taken from VDI Pool and RDS Farm levels, as these objects provide the resource. This is to ensure fair representation if you have Pod of different size.
Horizon World DC KPI = Average (VDI Pool DC KPI, RDS Farm DC KPI)
We do not include the Horizon server infrastructure at the KPI level. The reason is they are supporting metrics. They do not directly measure the user experience as none of their counters are session-specific. This is an example where we’re being careful in choosing KPI. Each KPI is ideally a primary metric, directly measuring the session performance. If you include supporting metrics, you can get false positive or false negative.
Leading Indicator
We covered in Part 1 Chapter 2 Performance Management that you need a leading indicator. The true KPI is a lagging indicator, so we need to complement it. The roll up technique matters so you balance the information.
A Pod can have thousands of sessions, so how do you roll up?
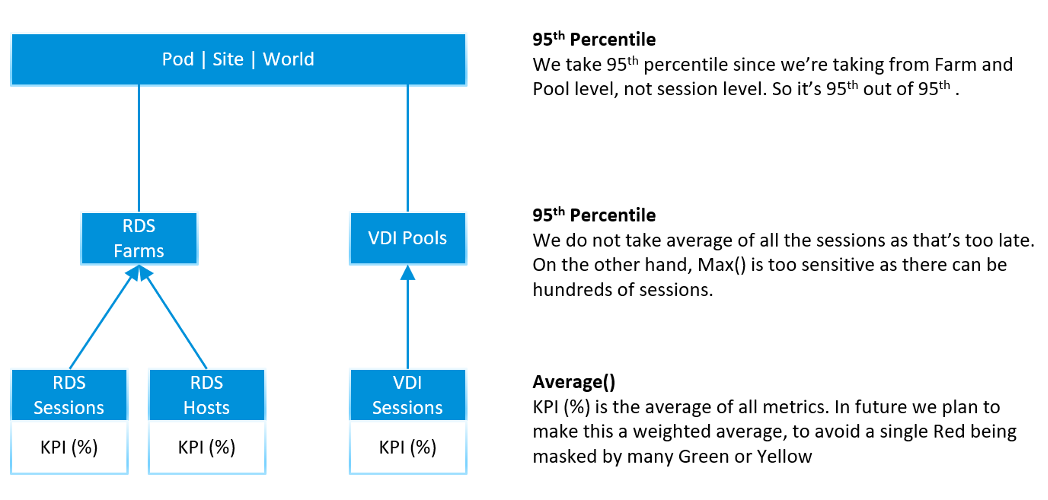
- Each session has a KPI (%). This is a balanced approach, so we can take its value.
- At Farm or Pool level, if you take the worst among sessions, the value may be bad most of the time. A better way is to take the 95th percentile, and then complement with a count of sessions in the red.
- At Pod level, take the same approach, which is 95th percentile, complemented with a count of sessions in the red
Using the above, here are the KPI metrics we have at the top level
- 95th Percentile Pod DC KPI = 95th Percentile of all its (Farm KPIs, Pool KPIs) values
- 95th Percentile World DC KPI. Identical formula to Pod, so expect this to be lower than the average of all pods
- 95th Percentile Pod Network KPI. Same approach with DC KPI, but obviously using Network KPI as input.
- 95th Percentile World Network KPI. You got the idea.
Yes, just 2 each for Pod and World, and 2 each for DC and Network. You need to keep it minimum so it’s easier to see over time.
At the Farm and Pool level, it’s the same approach.
- 95th Percentile Farm DC KPI = 95th Percentile of all its RDS Hosts DC KPI values
- 95th Percentile Farm Network KPI. Same approach with DC KPI, but obviously using Network KPI as input.
- 95th Percentile Pool DC KPI. Same approach with RDS Farm, but obviously using VDI Session DC KPI as input.
- 95th Percentile Pod Network KPI. You got the idea.
Now that we have the KPI, let’s look at the Horizon objects one by one, starting with the smallest/lowest one. We will also include all other performance metrics to complete the picture. To keep the list short and topic manageable, we will not include non performance metrics and properties. We will cover them separately.
Baseline Profiling
Horizon is one of the largest applications in a company, as it can span thousands of VMs and locations. It’s important to profile so you know what to expect. Different deployments can have a different performance characteristics, making it hard to establish best practice threshold. In a large scale deployment, different pools or farms can have different numbers. If your design expects a different performance for certain farm or pool, then profile them separately.
Take time to profile your actual environment while it’s healthy so you have a baseline.
We cover the profiling technique earlier in Part 1 Chapter 2. Specific for Horizon, you should profile the following counters.
| Object | Counters |
|---|---|
| RDS Session | Disk IOPS Frame Rate |
| RDS Host | CPU Queue CPU Context Switch Memory Page-in Rate Disk Queue Disk Outstanding IO Read IOPS and Write IOPS. Profile them side by side, and compare both against expectation. CPU Usage and Memory Usage. Compare against plan. |
| RDS Farm | Read IOPS and Write IOPS. Profile them side by side, and compare against expectation. CPU Usage in MHz. Make sure this number is within what the cluster can provide. Check the average does not exceed your sizing. |
| VDI Session | Same sets of metrics as RDS Host, as both are just VMs. You need to profile separately as your desktop pattern may differ to your server. |
| VDI Pool | Same sets of metrics as RDS Farm, as both are just collection of VMs. |
| Connection Server | Same sets of metrics as RDS Host. You need to profile separately as their pattern may differ. The profiling will also be useful after a major upgrade. For example:
|
| Horizon World | Disk IOPS. Make sure this number is within what your storage subsystem can handle. Network Bandwidth. Make sure this number is well within what your WAN link can handle, as majority of traffic is non-protocol traffic. |
As part of the baselining, you will know the typical size of a session, a user, an RDS Host. They form the building block for your sizing. Compare these numbers against the numbers you put in your sizing document (during the time you architected the system). If the reality is higher, you need to revise your plan and buy additional hardware.
RDS Session
Compared with VDI Session, RDS Session has less metric as it’s not the whole VM. An RDS Session is sharing one Windows OS with many other sessions. Windows do not provide detail breakdown for each session, and mostly report the metric at Windows level.
Contention Metrics
The following contention metrics are provided to troubleshoot further if the Network KPI (%) metric shows bad value.
| Latency (ms) | The protocol round trip time taken between Horizon agent (on DC) and Horizon client (in end user device). Keep this below the best practice shown in the KPI, or your acceptable number. |
Packet Loss Receive (%) Packet Loss Transmit (%) | The guidance for overall packet loss is anything above 1% is red. So the guidance for the receive and transmit should be the same, or a bit more stringent. The Agent sends pixels to the Client. If the Agent determines that it needs to drop packets due to network condition it drops them. So TX & RX are from the agent point of view. |
While the following metrics only impact at the initial stage, they are important to user experience.
| Time taken to load profile | The time starts after user has been fuly authenticated, when Windows begins the profile loading process and ends when the profile is fully loaded. The guidance for performance is
The guidance is lower than VDI because RDS sessions share the same Windows. The first user logging into Windows takes the biggest performance hit because Windows has to load all GPO policies, system settings, and services that load at login. The subsequent users don't suffer the same time penalty, because those items have already been loaded. There are features like "Session Pre-Launch" to mask the initial login time delay |
| Time taken to logon | The time starts when the user ID and password is submitted to Windows, and ends when the session is fully authenticated. It does not include the time taken to load the profile and launch start up application. The guidance for performance is
|
Utilization Metrics
Once you determine there is a problem, the next step is to narrow down if it’s CPU, Memory, Disk or Network
One common reason behind contention is high utilization. Not all usage metrics are relevant to performance, so the the following only lists the relevant ones.
CPU Usage (%) Memory Usage (%) | These values are coming from Windows, not VM. They track the relative consumption of a session againts the RDS Host total capacity. Make sure this number is below than expected average. For example, if you size for 20 concurrent users, then each session should be around 5%. |
| Disk IOPS | Unlike a server workload, users don't generally generate high IOPS or sustained IOPS. They open file, save file, but should not be sustaining for say 1 hour. |
If the network is over the WAN or mobile network, monitor the following metrics closely.
| Frame Rate | See this for explanation. A low frame rate result in inferior user experience. While occasional low is fine, a prolonged low could lead to degraded user experience |
| Bandwidth Utilization (Mbps) | Total bandwidth, although in VDI is mostly the agent sending data. Received metric typically covers users input like typing. Note it's megabit, unlike kilobyte that vSphere uses. You're welcome. |
RDS Host
RDS Host is a Windows Server running on a VM, serving desktop applications. In the current release of Horizon Adapter, there is no RDS application metrics yet. As a result, only Windows and Horizon metrics are used.
All the vSphere counters are explained in Part 2 of the book.
Contention Metrics
Use the contention metrics to troubleshoot further if the DC KPI (%) metric shows bad value. Once you determine there is a problem, the next step is to narrow down if it’s CPU, Memory, Disk or Network
The metrics can be grouped into 2: inside Guest OS and outside.
For the metrics inside, a major spike at the time of the incident could be the root cause as it’s not coming from outside (e.g. shared infrastructure)
| CPU Queue | High CPU queue is the primary counter that Windows needs more CPU. Either increase the number of vCPU or add more RDS host into the farm |
CPU Context Switch Memory Page-in Rate Disk Queue | Compare them against your baseline. The CPU Context Switch metric will be added in future. |
Next, check if there is a problem outside Windows, meaning at the VM or below.
| Peak vCPU Ready | Use Peak vCPU Ready instead of CPU Ready as the later is the average of all vCPU |
CPU Co-Stop (%) CPU IO Wait (%) CPU Overlap (ms) | These counters are at VM level, so they are not visible to Windows. Their values should be lower than CPU Ready. Expect them to be less than 1%. |
| Memory Contention (%) | Keep this below 1% |
Worst vDisk Read Latency Worst vDisk Write Latency | These metrics are better than the average of both read & write. You can have one problem and not the other, and the average may mask that. These metrics are better than average at VM-level. |
| Outstanding IO | Not yet implemented. In the mean time, use super metric. This is outside Windows. So if this is high, something wrong on the underlying storage system. |
For Network, check the protocol metrics. Note they are implemented at RDS Farm level, because RDS Hosts in a farm are meant to be uniformed. Meaning you should not be changing the setting of individual host, because they come from the same master.
- Protocol Latency (ms)
- Protocol Packet Loss Receive (%)
- Protocol Packet Loss Transmit (%)
- Worst Time taken to logon
- Worst Time taken to load profile
Utilization Metrics
One common reason behind contention is high utilization. Not all usage metrics are relevant to performance, so the the following only lists the relevant ones.
| Peak vCPU Usage (%) | Use the peak vCPU Usage instead of CPU Usage, as the later is the average of all vCPU |
| CPU Usage (%) | Note that at present this is coming from VM. In future we may change to Windows. If this number hits >95% repeatedly, that could explain contention. On the other hand, if this number is much lower than expected, there is something amiss. When you have a lot of sessions trying to connect and the RDS Host utilization is low, that means there is a bottlenect that prevents the host from processing the load. |
| Free Memory (MB) | Ensure this number is > 128 MB |
| Memory Utilization | As covered in Part 2, this contains buffer. In future we may change this to Windows In Use counter. Let me know your thought. |
Disk utilization is less useful in performance troubleshooting as the limit is high. A very high utilization may in fact deliver a good experience to the user, albeit at the expense of other users.
Read IOPS Write IOPS Read Throughput Write Throughput | If any of these is higher than normal, investigate why. It could be security agents scanning all files. Compare read and write to your expectation. Compare IOPS and Throughput. A large increase in IOPS but not in throughput indicate the block size has increased. Is that what you're expecting? |
RDS Farm
As RDS Farm is nothing but a collection of RDS Hosts + RDS Sessions, the metrics are derived from these objects. There is no raw metric at the RDS Farm itself.
KPI Metrics
As RDS Farm is a higher level objects, with potentially hundreds of members, the KPI metrics become a necessity in large scale monitoring.
For RDS Host, we take the worst value among the hosts as leading indicator. The reason is a farm typically consists of a dozen of so hosts, not hundreds. For RDS Session, taking the worst is good but need to be complemented with 95th percentile() or count() as there can be hundreds of sessions.
The following KPI metrics are provided to troubleshoot further if the Network KPI (%) and DC KPI (%) metrics shows bad value.
Worst Network KPI among Sessions (%) Worst DC KPI among Hosts (%) | The first metric you want to see is the KPI metrics. One for DC and one for Network. Check these 2 KPI metrics as they are at session level (for network) and RDS Host level (for DC). If they are not red, then the 2 metrics below will be 0. |
The above is what you need to monitor. If the number is bad, then check the following:
RDS Hosts with Red DC KPI RDS Sessions with Red Network KPI | Check these metrics if the above is showing red. They tell the severity of the situation by showing how many hosts are affected. |
95th Percentile DC KPI (%) 95th Percentile Network KPI (%) | If there is no session or host in the red, it does not mean they are not in orange level. Use these metrics to check. Note that if there are < 20 hosts in a farm, the 95th percentile is basically the worst counter. Take note that for rolling up to Pod and World level, the 95th percentile is a more balanced than worst() formula. |
Contention Metrics
KPI metrics are suitable for monitoring, not troubleshooting, as it’s an aggregate of metrics. To troubleshoot, you need contention metric-type.
It’s easier to troubleshoot at Farm level than individual host or session, as you can see the larger picture. There is no point troubleshooting a particular host or session if the whole farm is on fire. Different hosts and sessions can have different problems, and these metrics will capture them all as it’s worst among all members.
Use the Worst() metrics-type as they are the leading indicators. It shows the worst value among the RDS Hosts or RDS Sessions in the farm. They show the depth of a problem. If they show good value, no need to troubleshoot further as the worst is good.
First, check if there is a problem inside Windows.
| Worst CPU Queue | See RDS Host for more information. |
Worst CPU Context Switch Worst Memory Page-in Rate Worst Disk Queue | See RDS Host for more information. The CPU Context Switch metric will be added in future |
Next, check if there is a problem outside Windows, meaning at the VM or below.
Worst CPU Co-stop (%) Worst CPU Ready (%) Worst Memory Contention Worst vDisk Read Latency Worst vDisk Write Latency | See RDS Host for more information. |
The above is for Data Center, check if there is a problem in the network.
Worst Protocol Latency (ms) Worst Protocol Received Packet Loss (%) Worst Protocol Transmit Packet Loss (%) Worst time taken to load profile Worst time taken to logon | See RDS Session for more information. |
If the Worst() metric-type show something is wrong, then you want to know many hosts or sessions are affected. This is where the Count() metric-type come in.
| RDS Hosts with high disk latency | Number of hosts with disk latency > 20 ms |
RDS Sessions with protocol latency RDS Sessions with protocol receive dropped packet RDS Sessions with protocol transmit dropped packet | The threshold used is above 50 ms The threshold used is above 0.5% The threshold used is above 0.5% |
Utilization Metrics
One common reason behind contention is high utilization. Not all usage metrics are relevant to performance, so the the following only lists the relevant ones.
We take the same approach we did for contention metrics, which is start with Worst() then follow by Count(). The following are the Worst() metric type:
Peak CPU Utilization among RDS Hosts (%) Lowest Free Memory among RDS Hosts (MB) | See RDS Sessions for more information |
If the above shows something is wrong, then you want to know many hosts are affected. This is where the Count() metric-type come in.
RDS Hosts with high CPU utilization RDS Hosts with low available memory | The threshold used is above 95% The threshold used is above 500 MB |
The problem could be caused by unbalanced among the RDS Hosts. The unbalanced metric-type shows that.
Memory Usage Disparity among RDS Hosts (MB) CPU Usage Disparity among RDS Hosts (%) | The metrics reveal if the load is well balanced. Note that Load Balancer does not actually balance load. All it does is balance the number of connections. The problem is load on each session varies. Ideally, load balancer balanced on the RDS Host KPI. |
Finally, the high utilization could be caused by farm-wide spike. The average will tell us this.
Average CPU Usage Average Memory Usage | These are lagging indicators, so use this as the last resort. If the number is high, and the disparity is high, one of them host is likely saturated. |
Metric wise, RDS Farm differs to RDS Host as it has network metrics. As usual, check the worst first, then the average.
| Lowest Frame Rate | See RDS Host for more information. |
| Average Frame Rate | Is this is below 15 the user experience is affected. |
| Average Transmit Bandwidth | Average among all the sessions. We do not provide the highest among them. If you need it, let us know with the exact problem that requires you to need the information at this level. In the mean time, use super metric. |
Disk utilization is less useful in performance troubleshooting for the reason documented in RDS Host object.
Read IOPS Write IOPS Read Throughput Write Throughput | Sum, not average, from all RDS hosts. See RDS Host for more information. Make sure this is within what your storage subsystem can handle |
VDI Session
VDI Session is a VM with Horizon protocol, so the metrics are basically Windows and vSphere metrics.
Contention Metrics
We included KPI (%) if you need a single metric for ease of reporting or monitoring. It’s the average of DC KPI and Network KPI as both are equally important to the user experience.
VDI Session has the same set of contention metrics as RDS Host object & RDS Session object. So refer to them for the metric description.
Protocol Latency (ms) Protocol Received Packet Loss (%) Protocol Transmit Packet Loss (%) | See RDS Session for more information. |
| Time taken to logon | Note login will be faster if the user is reconnecting to the same desktop (disconnect vs logoff) |
| Time taken to load profile | The guidance for performance is
|
Utilization Metrics
VDI Session has the same utilization metrics as RDS Host object, because both are VM. The difference is it has network metrics, which are covered in RDS Session object.
VDI Pool
VDI Pool sports the same set of KPI metrics that RDS Farm has. The only difference is it uses VDI Session as the base object, reflecting the fact that a pool is nothing but a collection of VDI VMs.
Refer to the RDS Farm metric for the explanation. In summary, the metrics are:
Lowest Network KPI among VDI Sessions (%)
Worst DC KPI among VDI Sessions (%)
VDI Sessions with Red DC KPI
VDI Sessions with Red Network KPI
95th Percentile DC KPI (%)
95th Percentile Network KPI (%)
Contention Metrics
As per RDS Farm, we begin with checking inside Windows.
| Worst CPU Queue | The highest CPU Queue among the VDI Sessions. If this is high then look inside Windows. To reduce this you need to increase the number of vCPU, or move the user to a pool with bigger VM. |
Worst CPU Context Switch Worst Memory Page-in Rate Worst Disk Queue | See RDS Farm for more information |
If the above shows something is wrong, then you want to know many VDI Sessions are affected. This is where the Count() metric-type come in
VDI Sessions with CPU Queue VDI Sessions with Disk Queue | The threshold used Above 2. The threshold used Above 10 in Windows |
Next, check if there is a problem outside Windows, meaning at the VM or below. Check for both DC and Network
Worst CPU Co-stop (%) Worst CPU Ready (%) Worst Memory Contention | See RDS Farm for more information |
| Worst vDisk Latency | |
Worst vDisk Read Latency Worst vDisk Write Latency | Note these metrics do not exist yet for VDI Pool. In the mean time, use super metric. |
Worst Protocol Latency (ms) Worst Protocol Received Packet Loss (%) Worst Protocol Transmit Packet Loss (%) Worst time taken to load profile Worst time taken to logon | See RDS Session for more information |
If there is a problem, check how broad the problem is.
VDI Sessions with CPU Ready VDI Sessions with Memory Contention VDI Sessions with high Disk Latency VDI Sessions with protocol latency VDI Sessions with protocol receive dropped packet VDI Sessions with protocol transmit dropped packet | The threshold used is above 2.5% The threshold used is above 1% The threshold used is above 20 ms The threshold used is above 50 ms The threshold used is above 0.5% The threshold used is above 0.5% |
Utilization Metrics
One common reason behind contention is high utilization. Not all usage metrics are relevant to performance, so the the following only lists the relevant ones.
| Peak CPU Utilization among VDI Sessions (%) | Note this metric is yet to be implemented. If this metric hits >95%, one or more users could be needing more CPU, and perhaps should be migrated to VDI Pool with larger VM. |
| Lowest Free Memory among VDI Sessions (MB) | If this metric hits <1200 MB, one or more users could be needing more memory, and perhaps should be migrated to VDI Pool with larger VM. |
If the above shows something is wrong, then you want to know many hosts are affected. This is where the Count() metric-type come in.
VDI Sessions with high CPU utilization VDI Sessions with low available memory | The threshold used is above 95% The threshold used is above 500 MB |
For the network metrics, see RDS Farm.
Disk utilization is less useful for the reason explained in RDS Farm.
Note that the metrics Average CPU Usage and Average Memory Usage are intentionally not provided as they serve neither performance management nor capacity management.
The disparity metrics are not applicable as there are bounds to be disparity among users.
Horizon Pod
Now that we have the KPIs for all key objects, we can roll up. A pod is simply a group of VDI Pool and/or RDS Farm. It has Connection Servers but they are not in the data path once user is authenticated.
KPI Metrics
95th Percentile Network KPI (%) 95th Percentile DC KPI (%) | The primary metrics. Based on all the RDS Farms and VDI Pools in the Pod |
If the above is bad, then you dive into the individual farm or pool. If you want to see how bad the situation, use the following
Farms or Pools with Red DC KPI Farms or Pools with Red Network KPI | Aim for this number to be 0 as the farm KPI or pool KPI is the average of all their members. It's a lagging indicator. |
Network KPI (%) DC KPI (%) | While it's a lagging indicators, it gives the full picture. |
Since Pod contain Horizon servers, we add 95th Percentile Connection Servers DC KPI (%) metric to help in monitoring. From here, you dive into the individual servers.
Contention Metrics
Horizon Pod is too large an object to perform troubleshooting. You need to zoom into a specific farm or pool.
At the pod level, the following is provided as the number of data points is a lot less.
Worst time taken to load profile Worst time taken to logon | We use the worst instead of 95th percentile as it's an event, not metric. It does not happen every 5 minutes so the number of data points is a lot less. |
If you have a problem that impacts the entire pod, check at vSphere clusters and DC level as it could be something common.
Utilization Metrics
One common reason behind contention is high utilization. As Pod is a large object, its utilization can potentially exceed what the infrastructure is able to deliver. Start with the total utilization:
| CPU Utilization | Memory is not included as it's actually disk space. Disk space impact capacity, not performance. Memory usage matters in resource provider, such as ESXi. |
Disk IOPS Disk Throughput | If the number is higher than what you expect, then drill down to read and write. |
The problem could also be caused by high utilization within the VDI VM or RDS Host. You did profile your environment, didn’t you?
Since Pod contain Horizon servers, we add the following metric to help in monitoring. From here, you dive into the individual servers.
CPU Usage per Connection Server
Memory Usage per Connection Server
Horizon World
We do not aggregate at Horizon Site and Horizon CPA level to minimize footprint of vRealize Operations. If you have the need, let us know with the specific example. In the mean time, use super metric.
Similar to a Pod, start with the main KPI metric, and then you dive into a pod, and then into a farm or pool. You do not do troubleshooting at World or Site level.
This page was last updated on July 1, 2021 by Stellios Williams with commit message: "Added image alt-text, re-added links, cleaned Markdown, re-wrote most tables in Markdown"
VMware and the VMware taglines, logos and product names are trademarks or registered trademarks of VMware in the U.S. and other countries.