2. The 3 Realms
In the big picture, there are three main realms of enterprise applications. Each realm has its own set of teams. Each team has a set of unique responsibility and hence skills required. The following diagram explains the three realm, alongside with typical layers within each realm and questions being asked.
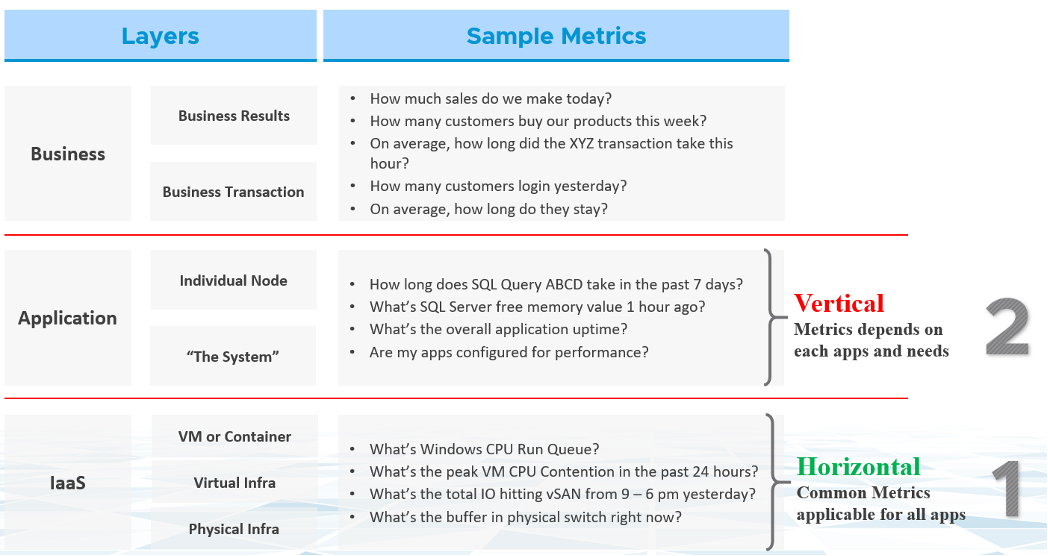
Performance troubleshooting is largely an exercise in elimination. The methodology slices each layer and determines if that layer is causing the performance problem. Hence it is imperative to have a single metric to indicate if a particular layer is performing or not. This primary metric is aptly named Key Performance Indicator. We will cover it more here.
The upper layer depends on the layer below it, and hence the infrastructure layer is typically the source of contention. As a result, focus on the bottom layer first, as it serves as the foundation for the layer above it. The good part is this layer is typically a horizontal layer, providing a set of generic infrastructure services, regardless of what business applications are running on it.
Now, we don’t know the impact to the application when there is latency in the infrastructure. That depends on the application. Even on the same identical software, e.g. SQL Server 2019, the impact may differ as it depends on how you use that software. Different natures of business workload (e.g. batch vs OLTP) get impacted differently even on the identical version of the software.
Depending on the application and infrastructure architecture, there can be more stacks or layers. The following example shows 5 layers. The challenge in performance troubleshooting is the layers may not share context.
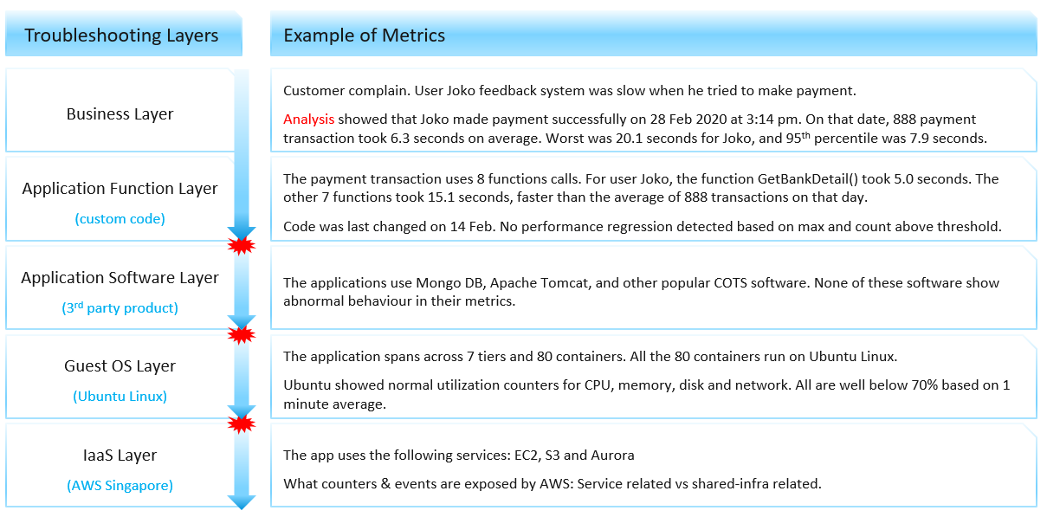
Using the example above, we can demonstrate how the lack of visibility is making troubleshooting virtually impossible. Let’s run through the above. The story starts with a complain as that resonates better.
At the Business Layer, you can see the performance of each business transaction. You not only know which user was affected, you know what transaction was affected as the metric has transaction ID. You can trace it in the code as you know how long each function calls take place, assuming you log for every single transaction.
The problem starts when you move beyond your code and into Commercial of the Shelves (COTS) software. The software may show that its queue is 10000, which is 5000 more than what the manual say it can handle. But you have no idea if user Joko transaction was in that queue or not. The COTS software metrics do not relate to users anymore, let alone individual transactions. The red explosive icon marks where context is lost.
Moving from application to infrastructure resulted in another loss of context. Windows or Linux has no idea what applications you’re running. As far as the OS is concern, every application is just a process. It will report basic CPU, Memory, Disk and Network utilization per process. More advanced counters are reported at OS-level, system wide. For example, you do not know if your process was the one experienced network packet loss. The packet counter loss is a system-wide metric.
Moving from individual EC2 or VM to the shared infrastructure results in another loss of context. In the case of public cloud, you may not get visibility into the physical layers at all.
This page was last updated on June 25, 2021 by Stellios Williams with commit message: "Removed UTF8 apostrophe"
VMware and the VMware taglines, logos and product names are trademarks or registered trademarks of VMware in the U.S. and other countries.