10. Baseline Profiling
How do you profile your environment in order to set a threshold? How do you determine what’s acceptable? What’s the actual value in the last few months?
All the above can be answered via profiling your environment.
Let’s say you have 5000 VM across 10 clusters. All these clusters provide the same class of service. You want to prove if 5% CPU Ready for VM is a good threshold, or you want to know the actual CPU Ready experienced by these VMs in the last 3 months.
You want to profile at least the last 3 months of data, so that any peak within that period is not excluded. Since vRealize Operations stores this counter every 5 minutes, you will have 288 datapoints in a day and 26,298 datapoints in 3 months.
Step 1
For each cluster, you measure the worst CPU Ready experienced by any VM.
A cluster with 500 VM will be represented with whatever VM that happens to experience the highest CPU ready at that 5-minute interval. So for every 5 minutes you analyze 500 metrics and take the worst.
Step 2
You do the above for 3 months.
Since there are 26,298 datapoints in 3 months, that means you analyze 13,149,000 data points
Step 3
Taking the worst among 13+ millions will likely return you with an outlier.
To address it, you take the 99th percentile, after comparing the value at 100th, 99th and 95th. The average is not applicable as you want to be near the peak.
You record this as the worst CPU ready for that cluster in the last 3 months.
Step 4
You repeat Step 1 - 3 for each cluster.
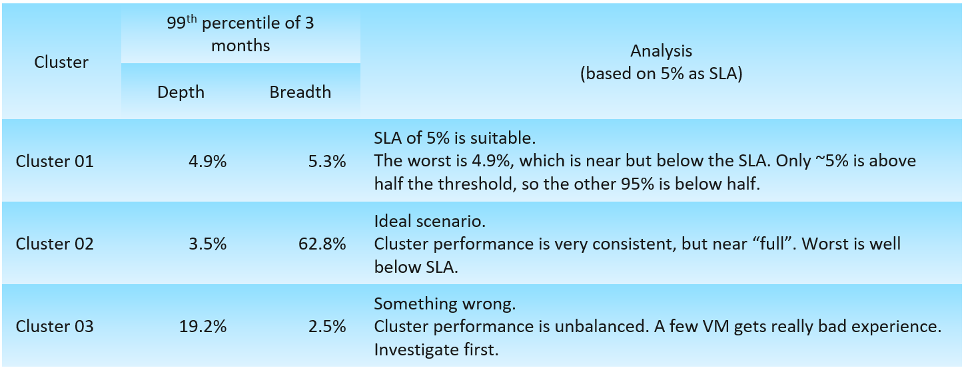
The above gives you the depth of the problem. As covered previously, you need to complement this with the breadth of the problem. The step is similar, except in Step 1 you calculate the percentage of VM experiencing > 2.5% CPU Ready.
Why 2.5% and not 5%?
To give you better visibility as the number >5% maybe too small.
Once you do the above for all the clusters, you may end up with something like this.
What if you want to see the actual distribution of VM CPU Ready in the last 3 months? You can do so by creating a bar chart and specifying the distribution buckets. In the following example, I specify 0% - 1%, 1% - 2%, until 5% as those are the range that I’m interested.
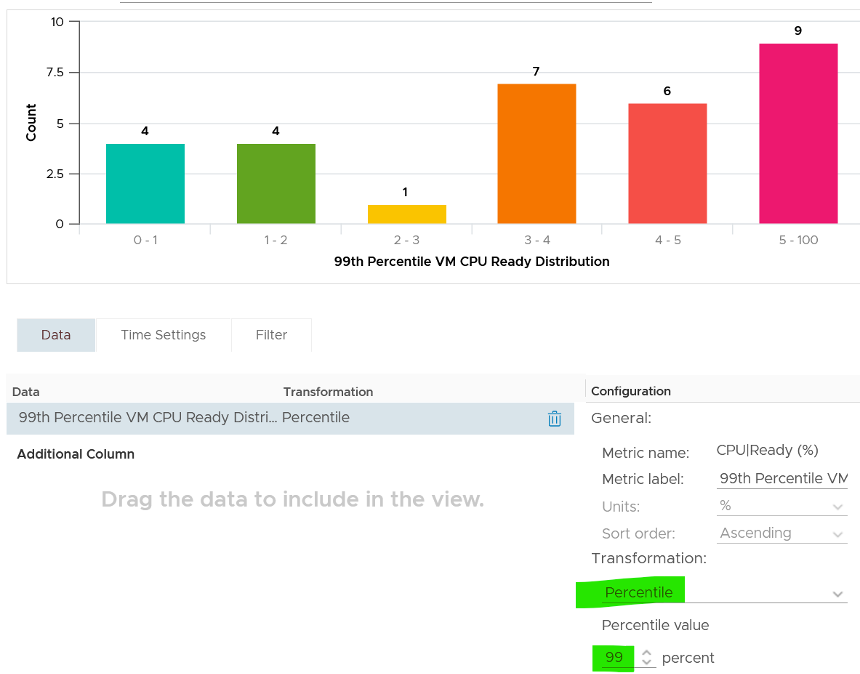
Notice I set the value to be the 99th percentile in this case, as taking the Max may give outlier.
If you want to see more example, I apply this baselining technique to figure out the value of CPU Context Switch and CPU Run Queue.
This page was last updated on June 29, 2021 by Stellios Williams with commit message: "Replaced non-ascii hyphen"
VMware and the VMware taglines, logos and product names are trademarks or registered trademarks of VMware in the U.S. and other countries.